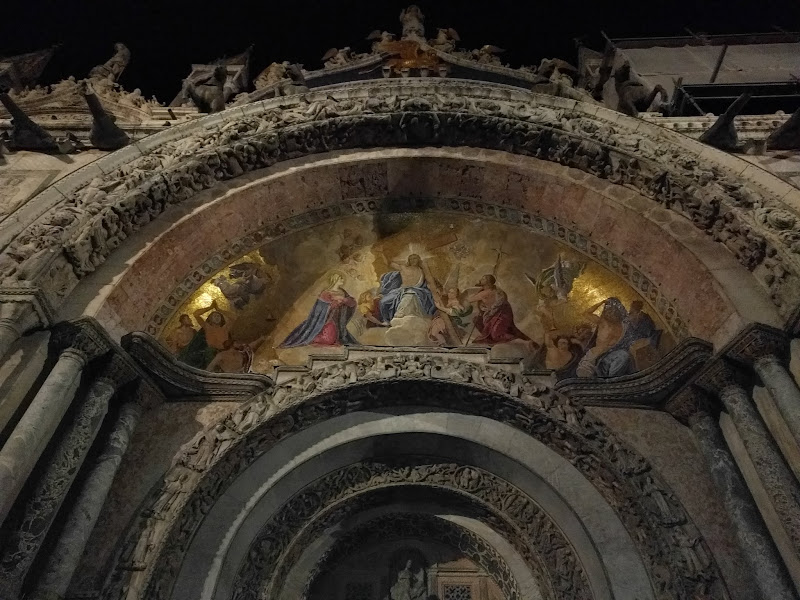
A few years ago I was visiting Venice. It was a fascinating experience to walk around this ancient city without cars, built on some islands in a lagoon that protected it from the chaos after the fall of the West Roman Empire. I was surprised how eastern some of the architecture looked, because I hadn’t known how tight the connections were between Venice and the Byzantine empire, the successor state to the East Roman Empire. More than a thousand years of history come alive when you walk those ancient cobble-stoned streets.
For a long time Venice has been slowly sinking into the sea. In many buildings I saw, the ground floor was more or less uninhabitable and ruined due to water damage or the risk from regular flooding during storm surges. Sadly, despite all efforts to save it, Venice will disappear in the ocean, gradually swallowed up by rising seas.

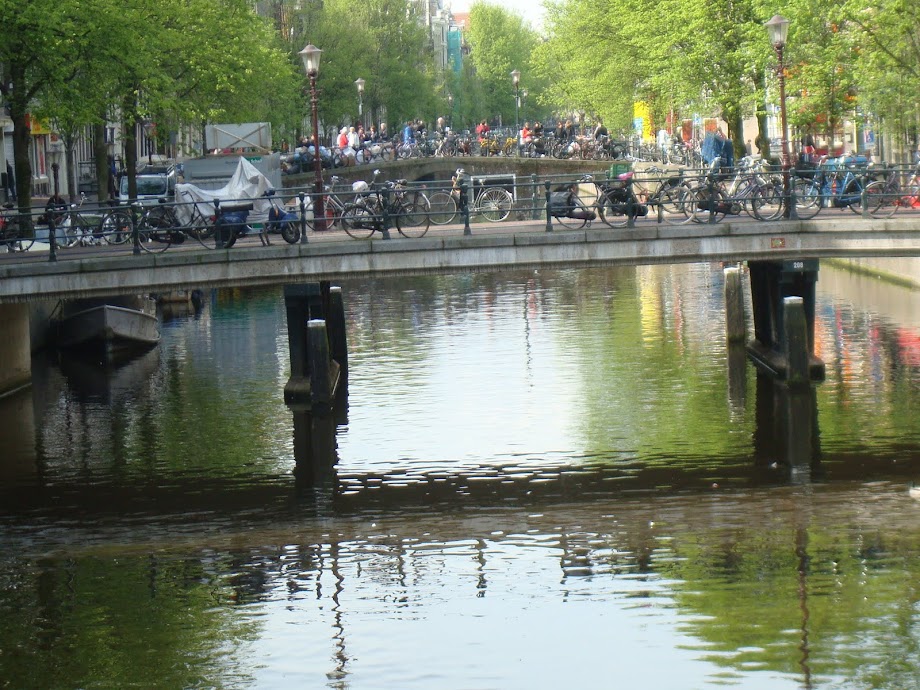
The same will happen to Amsterdam, once the capital of a trading nation from where ships sailed to every continent. And not just this city will disappear, but almost the entire country of the Netherlands. It’s not a question of if but when.
Its inhabitants will gradually migrate to other countries in Europe, such as Germany, France or Spain that will be less affected by a 20 m rise of global sea levels. The Netherlands will be virtually wiped out when that happens. So will be Bangladesh and many island nations, as well as Miami, Shanghai, Bangkok, Jakarta, much of Tokyo, London, New York City and many other coastal megacities around the world.
When I was a schoolkid, I learnt from science books that 0.3% or 300 ppm of the earth’s atmosphere was carbon dioxide (CO2). I wasn’t told that only 200 years earlier, before the Industrial Revolution it had only been 280 ppm. Later I learnt that CO2 is a so called “greenhouse gas”, as it traps heat from the surface of the earth and prevents it from escaping into space, thus raising the surface temperature of the planet. As our civilization burns coal, oil and gas and clears forests the CO2 level increases and the greenhouse effect intensifies. In the last couple of decades this has been happening at an increasing rate.
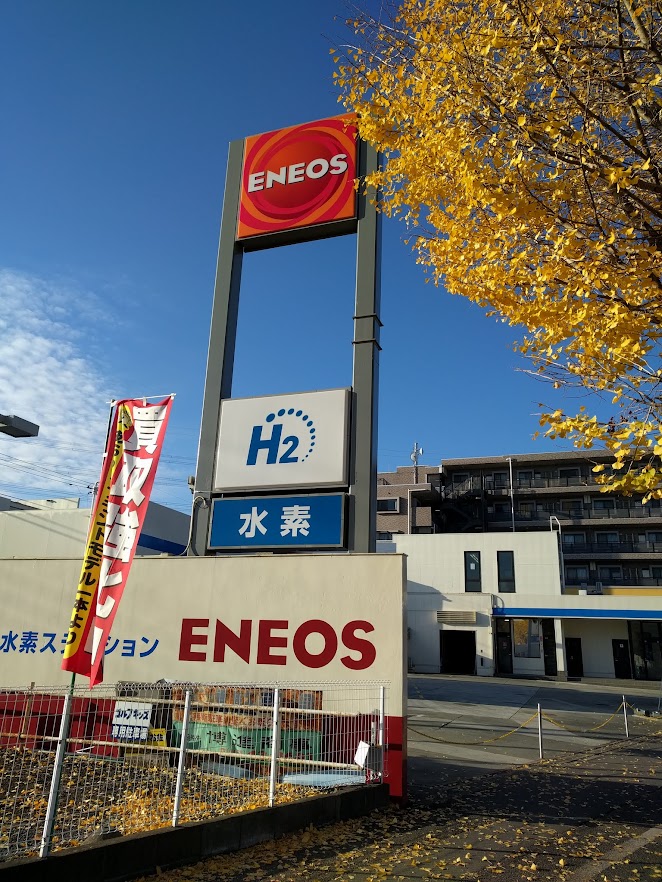
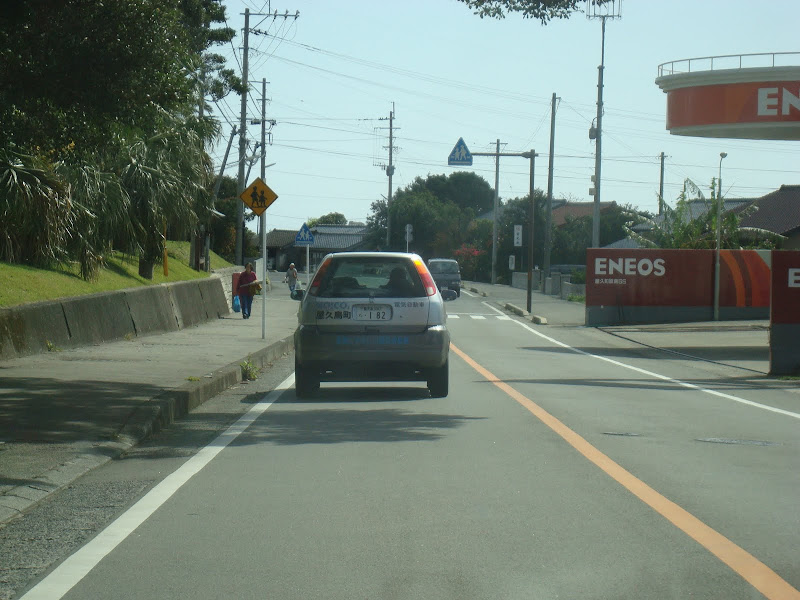
Last year the world consumed about 100 million barrels of crude oil a day. 99.6% of passenger cars on the roads worldwide in 2018 run exclusively on fossil fuels. Worldwide power generation from coal is growing rapidly and is expected to double from 2011 to 2023. Of all the fossil fuels, coal releases the highest amount of CO2 per kWh produced, yet many countries are still building new coal-fired power plant capacity, including here in Japan, where a TEPCO – Chubu Electric Power joint venture still wants to open a new coal-fired power station in Kurihama near Tokyo in 2023/2024.

In 2013, the 400 ppm level was already breached and it is still rising at an increasing rate. How significant is that number? Since humans walked on this planet it had never been as high as this: You have to go back millions of years to find an era when there was as much CO2 in the atmosphere: The last time the CO2 level was above 400 ppm was in the Pliocene (about 3-5 million years ago).
At that time the average global temperature was some 2-3 C higher than today, but temperatures in the arctic and in Antarctica were significantly higher than that. Trees were growing in the southern part of Greenland, which was not covered in thick glaciers as it is today. Trees were also growing in parts of Antarctica. Without billions of tons of water locked up in glaciers in Greenland and Antarctica, sea levels were 20-25 m higher than today. Also these oceans were warmer than today and water expands when it warms up. The rising CO2 levels will melt these glaciers again, until a new equilibrium is established several hundreds years or more in the future. The coast lines will move, gobbling up cities and farm land alike. Ultimately they may well look like those in the Pliocene again, but how much ice will melt and how rapidly it will melt still depends on what we do from now.
To give you an idea of the long term impact of this kind of sea level rise, the former Chinese capital of Nanjing, 200 km from the Yellow Sea, lies only 20 m above sea level. With 25 m of sea level rise the ocean would penetrate about 180 km inland southwest of Beijing. Some of the most densely populated areas of China (national population: 1.3 billion) would be swallowed by the sea.
In Vietnam the two biggest cities, Hanoi and the Red River plain around it, and Ho Chi Minh City (Saigon) and all of the land southwest of it will drown. Many of Asia’s river plains that are now its biggest rice baskets will turn into continental ocean shelf. The same will happen in the Nile valley or along the Euphrates and Tigris in the Middle East.
Note that these are changes that will happen over the next centuries or more regardless of what we do from now. They are the least bad outcome of what is possible. If we do nothing, it will get far worse.
There are feedback cycles that amplify the negative effects. For example, once it gets warm enough in summer in arctic permafrost regions that the ground will melt in summer, then peat and other frozen organic matter in the wet soil will start to decay, releasing huge amounts of methane, an even more powerful greenhouse gas than CO2. This in turn will raise temperatures even higher. Where white sea ice melts in the summer, darker ocean water is exposed below, leading to more sunlight being absorbed and higher air and ocean temperatures. This in turn leads to less sea ice coverage the next year. When snow on top of glaciers thaws and refreezes, it also changes its albedo. The ice absorbs more sunlight than the virgin snow. So every warm spell leads to more warming. Once the thick ice sheet in Greenland and East Antarctica starts melting, its elevation will drop. It’s colder at higher elevations. The reduction in thickness will speed up melting. We could end up with a run-away effect that is impossible to stop until there is no ice left (see this article in National Geographic for maps of what the world will look like then).
The young Swedish climate activist Greta Thunberg, who started campaigning against inaction against climate change as a 15-year old, used the image of a “house on fire”:
Our house is on fire. I am here to say, our house is on fire. […] Adults keep saying: “We owe it to the young people to give them hope.” But I don’t want your hope. I don’t want you to be hopeful. I want you to panic. I want you to feel the fear I feel every day. And then I want you to act. I want you to act as you would in a crisis. I want you to act as if our house is on fire. Because it is.
The changes brought about by man-made climate change will be dramatic, but political action so far has been underwhelming. The steps taken so far or even the steps discussed in public fall far short of what is necessary to avoid even worse outcomes.
There is considerable resistance to taking action against Climate Change. We are not used to thinking much about events beyond our own life time. Politicians will worry about the next elections, business leaders about their next annual business results. Politicians tend to take drastic action only in wars and other major disasters, but Climate Change is going to be bigger than any (non-nuclear) war or hurricane.
If we were honest and ethical, we would not put the stock market value of our power companies or car or airplane manufacturers or our airlines or tourism industry above the future of the planet. The resistance to change from both industry and consumers will be huge, but we owe people the unvarnished truth: That we can’t continue with business as usual.
Even if we switch to electric cars, the steel, copper and glass for those cars for now will be made using fossil fuels. Even the wind turbines, solar panels and battery storage that we have to build at a massive scale to supply renewable energy for our future civilization will largely be manufactured using fossil fuels for years to come. We have to spend our dwindling carbon budget wisely, for example on rebuilding infrastructure instead of on holidays in Bali or a shiny new BMW SUV.
There is as yet no clear technical solution for air travel or for international cargo ships without fossil fuel. The same is true for making cement or for steel production from iron ore. In the short term we could replace kerosene or heavy fuel oil with LNG to reduce CO2 output in transport, but that is not enough and we will need to go much further than that. The next steps will be much harder. We don’t have the solutions yet. Therefore we need a modern moonshot program for a post-fossil future, an all-out effort — not to put more humans on the moon again — but to decarbonise our economies.
Over the last year Greta Thunberg has become a household name worldwide. She has drawn attention to the urgency of change and to the drastic nature of the changes needed. Her youth and thus her expected life span versus those of the politicians and business leaders of today, who mostly won’t be around after the year 2050, gives her a different perspective which the rest of us can then also relate to. It’s not all about us, but about our children and all of humanity after us. Sometimes it takes a child to educate the world.