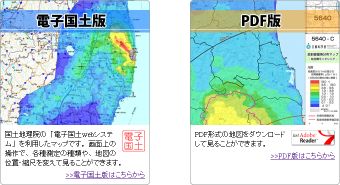
The Japanese government has published online map data about radiation levels in Eastern Japan. You can zoom in and out, scroll around and select data from:
- Background radiation in microsievert per hour
- Contamination by caesium 134 and 137 combined (Cs-134+Cs-137) in becquerel per square metre
- Contamination by caesium 134 (Cs-134) in becquerel per square metre
- Contamination by caesium 137 (Cs-137) in becquerel per square metre
The data was collected via helicopter flights carrying instruments that detect gamma radiation of different energy spectrums, allowing a breakdown by isotopes causing it.
There are the following data sets:
- April 29
- May 26
- July 2
- Miyagi prefecture, July 2
- Tochigi prefecture, July 16
- Ibaraki prefecture, August 2
- Chiba and Saitama prefecture, September 12
- Tokyo and Kanagawa prefecture, September 18
Click on this link:
either the online maps or download PDF files of the maps and click on “同意する” (“I do agree”, the left button) to get access.
The government is planning to extend the radiation survey to the whole of Japan, not just within about 250 km of the wrecked reactors as is currently the case.
See also:
- Tepco’s unfiltered vent path (2011-08-25)
- “Okutama is no Chernobyl” (LTE in Japan Times, 2011-10-20)


Pingback: My Terra-P dosimeter (MKS-05) by Ecotest