
Recently I came across an article that quoted a Forbes commentary (“Sue OPEC? Congress Should Sue Itself”, 2008-07-09) comparing solar energy development in the USA (or lack thereof) with the situation Germany, where 2010 was a veritable boom year for photo-voltaic panels.
Two maps and one quote underneath caught my attention:
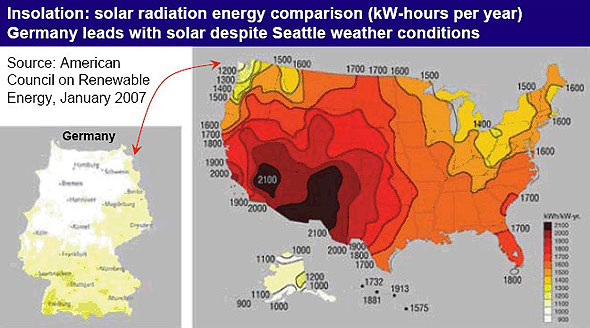
Check out the map above. With the exception of Seattle, the entire continental U.S. is much sunnier than Germany. Yet Germany has 17 times the installed solar base per capita.
According to the map, Germany received amounts of sunlight comparable to the region around notoriously cloudy Seattle and arctic Alaska, while most of the states along the Canadian border got 50% more sun than the Southern half of Germany.
This did not seem plausible to me. While it’s true that most of Germany lies further North than the 49th parallel that marks most of the US-Canadian border and should therefore receive less sun than most of the US, most of Germany’s climate is far sunnier than Seattle, which lies about as far North as Mannheim or Nuremberg (Nürnberg) in Southern Germany. Based on latitudes and annual rainfall, solar insolation (the amount of solar energy radiated onto a given area) should be largely comparable between at least southern Germany and the northern US outside the Pacific Northwest. I’ll give you some data to verify this theory.
Here is a map of insolation for the entire US, showing kWh per square metre per day at latitude tilt (multiply by 365 for annual figures like in the Forbes map):
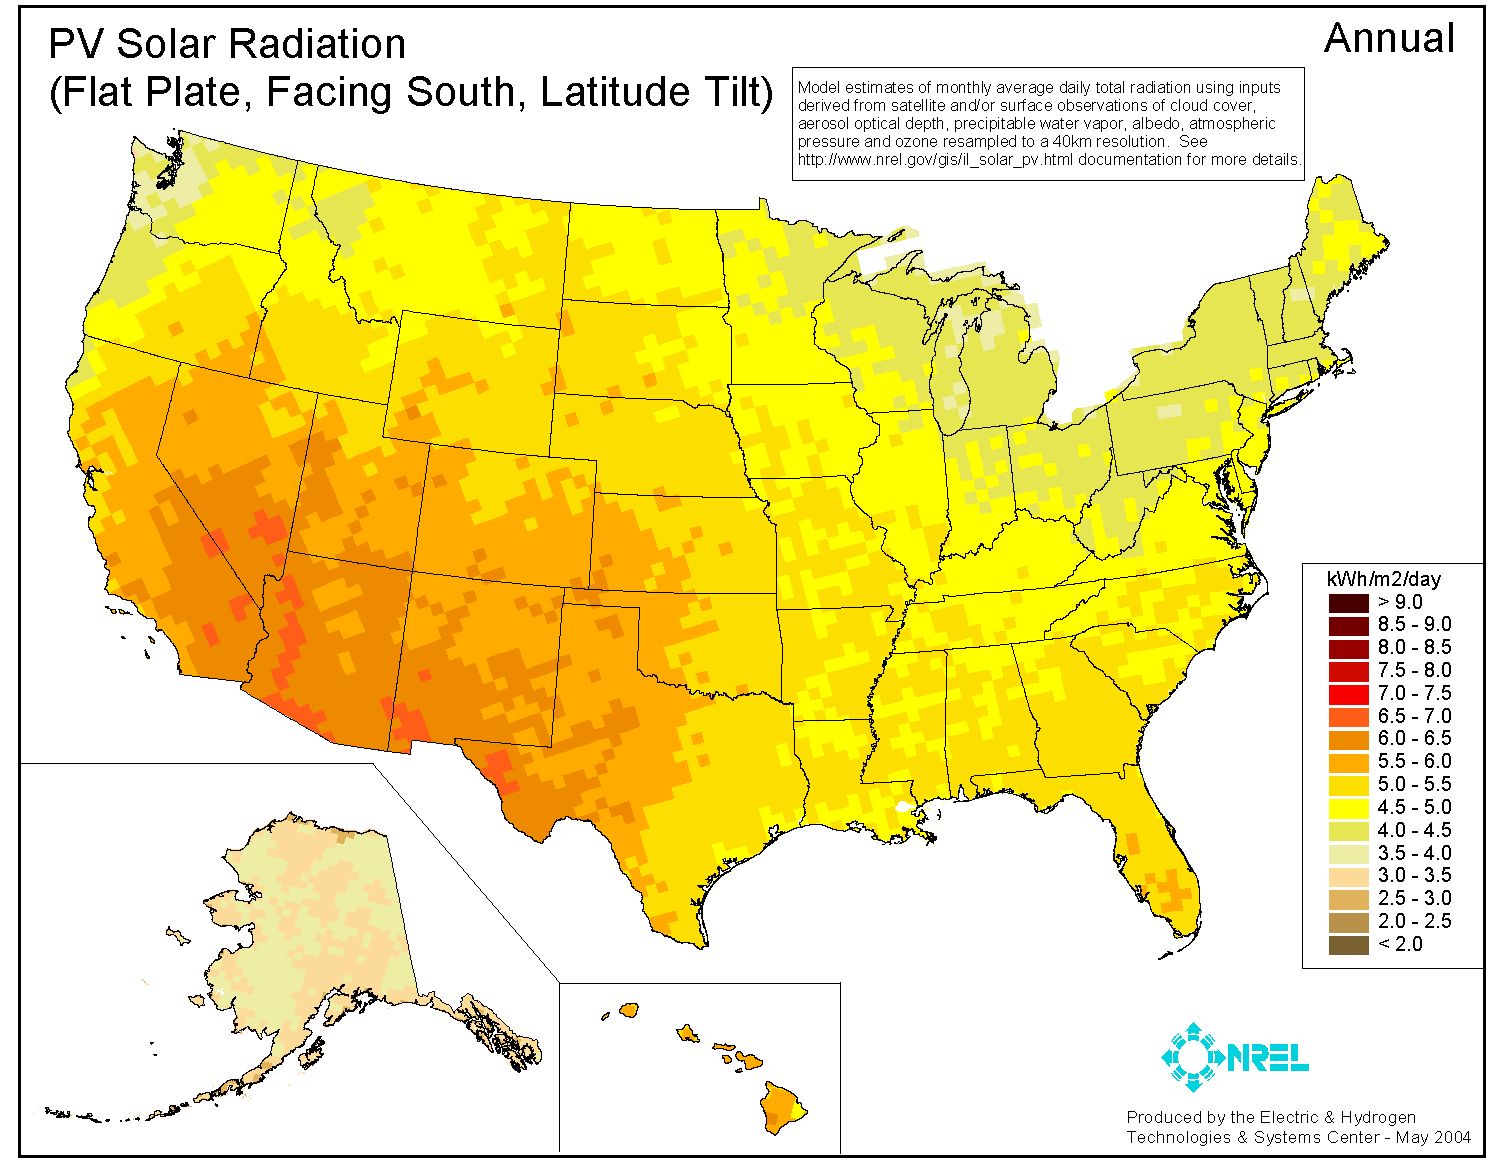
As you can see, most of the US gets between 4 and 5.5 kWh/day (yellow-grey to dark yellow), or 1450-2000 kWh per year.
And here is a map of insolation in Germany, showing horizontal irradiation in kWh per square metre per year:
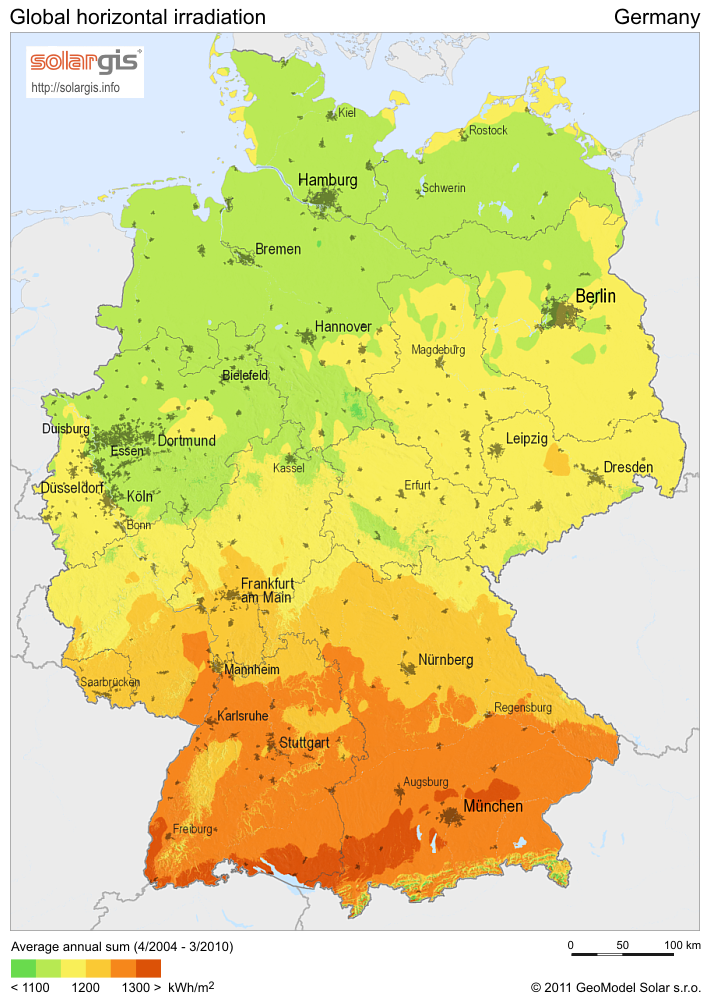
Note that the colour scale is not the same. The southern part of Germany gets 1200 kWh and more per year, the northern part less than that.
But that’s not the whole picture. If you you paid attention, you noticed the “at latitude tilt” (US) versus “horizontal irradiation” (Germany). It makes a big difference, because without taking it into account, the comparison of the raw numbers become an apples to oranges comparison: The numbers in both maps don’t actually measure the same thing!
The further you move north, the lower the sun stands at midday to the South. Consequently, when you install solar panels anywhere but in a tropical country, you don’t install them horizontally but make sure to tilt them at the right angle to catch the most sun per square metre of expensive panel, based on the average position of the sun at noon throughout the year, which depends on your distance from the equator. It will be more tilted at a more northern location than somewhere further south.
The US solar data is measured per square metre of panel. The German data however is per square metre of shadow the panels cast on the ground, which is not the same. The two ways of measuring insolation only match at the equator.
Let’s look at an example: In Chicago, at around 42 degrees North, a solar panel tilted 42 degrees towards south is exposed to 37% more sun than a flat piece of lawn of the same size (1/cos(42 degrees) = 1.37). So a one square metre panel’s 1500 kWh/year in total solar irradiation in Chicago is basically the same as 1100 kWh of horizontal exposure, which is the same or less than you catch just about anywhere in Germany. Far from being comparable only to rain-swept Seattle, Germany’s annual exposure to the sun is actually not too different from the US east of the Mississippi, except for the Southern sunbelt from Texas to Florida, which does get more sun.
So what do we learn from this?
1) As our physics teacher always used to tell us: Watch your units! Numbers don’t tell you anything unless they go with the proper unit.
2) The German solar subsidy program is no crazy boondoggle at taxpayer’s expenses. Solar energy does make sense in Germany, as it does in most other countries in temperate climates.
Of course it makes even more sense in dry climates like Spain, Turkey, North Africa and the arid US Southwest, where it’s ideal. On the other hand, Seattle or Iceland may not be the greatest places for it.
Ideally, solar energy investment should start where it brings the highest returns, accompanied by sufficient investment into a power grid that can carry power wherever it’s needed.
In 2010, Germany produced about 1.9% of its electricity usage from solar panels, almost double what it was the year before. By 2020 this is expected to more than triple again, to 40 GWh or 6%. As mass production brings costs down while oil prices keep going up, German solar electricity is expected to become cost-competitive with conventional power by about 2015, which will be great for cutting dependence on dwindling oil reserves.
Also, let’s not forget that solar energy is not the only renewable game in town: Wind for electric power is already much more competitive on a cost per kWh basis than photovoltaics and deserves more attention. Many regions that have relatively poor solar prospects have excellent wind opportunities, for example Scotland. A mix of solar and wind often works better than just one or the other.
Germany has great potential for wind power, both land based and off-shore, and so do the US. What is holding wind power back particularly in the US (but to some extent also in Germany), is an under-sized grid that can not move enough power over the necessary distances from areas with plentiful wind to where the power is needed. Investment in a 21st century power grid will be essential for a low-carbon future.
Thanks for the research and information. The maps and explaination of how they were to be inturpreted were great.
Solar/wind energy has interested me for yrs. – does not surprise me that Germany is ahead of the US – we want instant gratification, and to see a positive outcome from viable areas would require an extensive ‘grid’ as you say. With our economy/politics etc,,, in such chaos, I believe only a great act of philanthropism could establish that which we would greatly benefit from in say 10 yrs+. Proponents can only continue research/ support/development until then.
You put up excellent maps/stats/theory. Nice going. I would love to see what the great deserts of the world (if we could not harm the ecosystems) might do. Thank You.
An article in Slate has repeated the mistaken claim that the amount of solar energy that hits Germany was comparable to Seattle or Alaska, see: http://www.slate.com/blogs/future_tense/2013/02/07/fox_news_expert_on_solar_energy_germany_gets_a_lot_more_sun_than_we_do_video.html
Hmm. I stumbled onto this blog post a couple of days ago in the comments to the Slate article. While it seemed compelling at first, it turns out that all the other data about solar irradiation I found (e.g. from http://soda-is.com) seems to be consistent with the figures given in the original maps.
Would you mind sharing your sources?
(And no offense intended. I like your blog, or what I’ve seen of it; it just seems to me that your data is off on this point.)
I agree you have a point. The soda-is.com maps also seem to suggest that insolation in Germany is comparable to Alaska, for example in the colour codes on this world map:
http://soda-is.com/img/map_ed_13_world.pdf
The colour codes indicate 80-90 W/m2 = 700-790 kWh/m2 per year for North Germany and 90-100 W/m2 = 790-880 kWh/m2 per year for South Germany.
The German horizontal irradiation map I referenced was found here:
http://solargis.info/doc/_pics/freemaps/1000px/ghi/SolarGIS-Solar-map-Germany-en.png
These maps suggest numbers in the 1000-1200 kWh/m2 per year range.
Here is a European map with roughly similar numbers:
http://solargis.info/doc/_pics/freemaps/1000px/ghi/SolarGIS-Solar-map-Europe-en.png
There clearly is a considerable discrepancy in the data.
Pingback: Myth: There's Not Enough Sun in New York for Solar Power
Sorry- I know this is an old post- but I’m not sure it’s true that Germany is significantly sunnier than Seattle. In terms of annual hours of sunshine (defined as direct solar radiation at >120Wm-2), Berlin (1750 hours) is about equal with Paris, above oceanic London (1600) but significantly below Seattle (2100), which from my understanding has dreary winters but a nice Mediterranean influence in the summer.
Interestingly on this new map- https://globalsolaratlas.info/map – you can get exact figures for cities and hence can directly compare them with the same metric. Do you suppose the ‘Global tilted irradiation at optimum angle’ figure is the one that discounts latitude advantage? Sounds like it but I can’t say I know much about the topic!
Considering German electricity prices skyrocketed following their large scale deployment of wind and solar, they’re probably not the best posterchild for clean energy transitions,.. especially since the unreliability of said renewables has perpetuated Germany’s continued use of dirty brown coal, in light of their nuclear phase out. A better roll model might be France, with their extensive use of nuclear,. who have managed considerably lower electricity prices than the likes of Germany or Denmark, and very low carbon intensity electricity to boot.
In 2019 feed in tariffs made up about 21% of electricity prices in Germany. Nevertheless, prices have been essentially flat since 2013, while market share for renewables has been growing dramatically, accounting for 55.8 percent of Germany’s net electricity generation during the first half of 2020. Meanwhile the share for lignite and thermal coal was down to 13.7% and 6%, respectively.
The French nuclear industry is being touted as a carbon-free alternative, but that isn’t quite so if one takes into account mining of the ore and enrichment for fuel element production. The major drawback of nuclear (besides the risk of major disasters such as in Chernobyl or Fukushima) are the large quantities of highly radioactive waste that will need to be contained safely for tens of thousands of years. For a civilization that seems to have trouble dealing with problems more than 4 years into the future, that is an incredible commitment to take on for us and our descendants.